

If you’re only tracking what already happened (injuries, lost time, costs), you’re driving by looking in the rearview mirror. If you’re only tracking safety activities (training completed, audits done), you have no idea if those activities actually prevent injuries.
According to a 2024 VelocityEHS study, 89% of companies track leading indicators, but 79% still can’t prove ROI. Why? Because tracking both types of metrics isn’t enough. You have to connect them. This guide shows you what to measure and why both types work together to give you the complete picture.
What are safety metrics? Key performance indicators (KPIs) that measure how well your safety program protects workers. They fall into two categories: lagging indicators (what already happened) and leading indicators (early warning signals).
| Lagging Indicators | Leading Indicators | |
| What They Measure | Outcomes (what already happened) | Activities (what’s happening now) |
| Timing | Reactive (after the fact) | Proactive (before incidents) |
| Examples | TRIR, DART, injury costs, lost workdays | Near-misses, training, audits, observations |
| Best For | Compliance, benchmarking, trend analysis | Risk prediction, prevention, early warning |
Lagging Indicators: Measuring Past Outcomes
Lagging indicators are reactive. They measure injuries, illnesses, and costs after they occur. Required for OSHA compliance and useful for benchmarking, but they only confirm your controls already failed.
| Indicator | What It Measures |
|---|---|
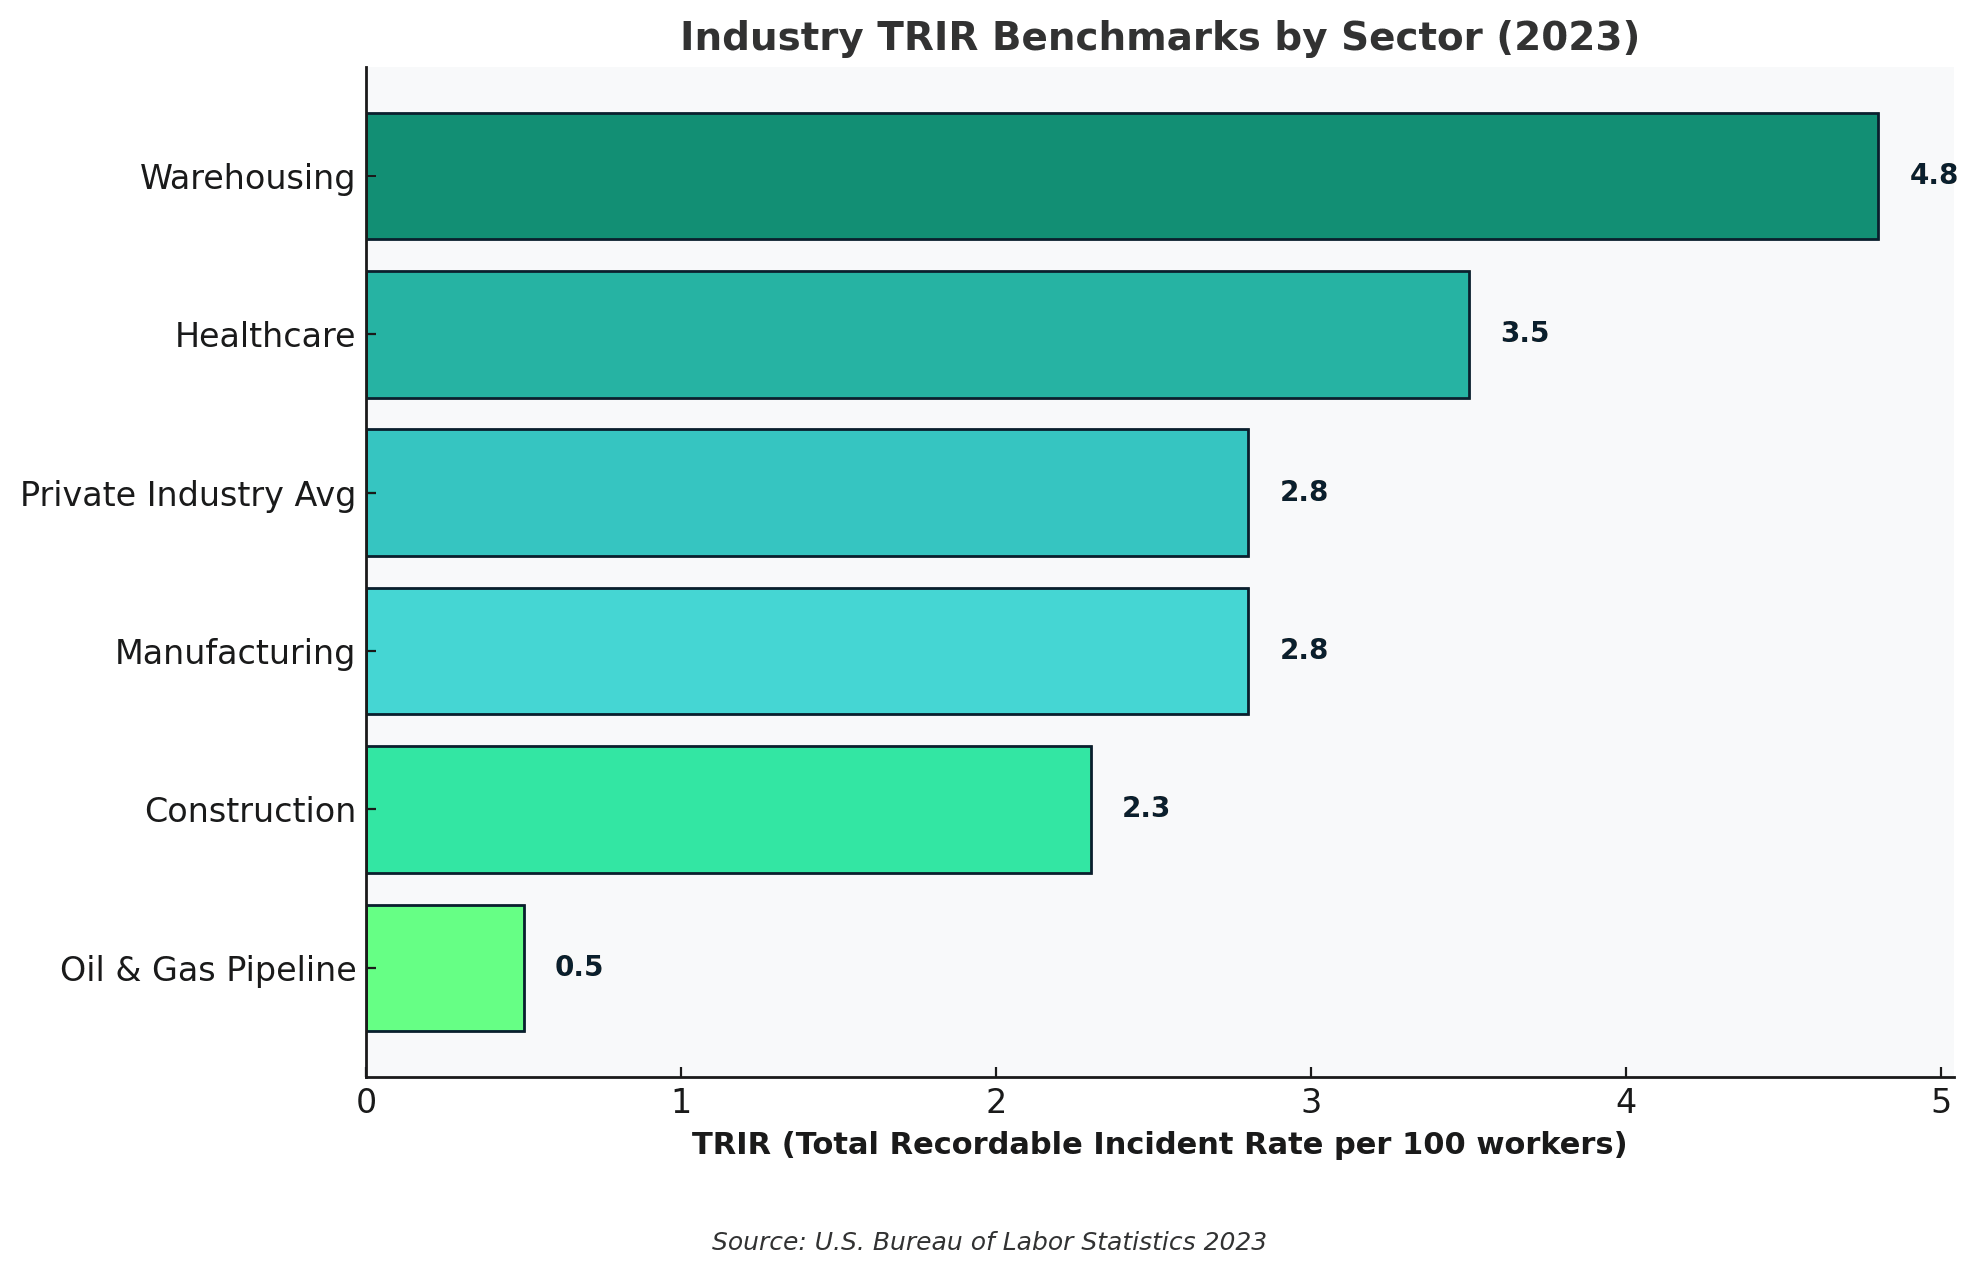
| TRIR | Total Recordable Incident Rate. OSHA-recordable injuries per 100 workers. Industry average: 2.8 (Construction: 2.3, Manufacturing: 2.8). |
| DART | Days Away, Restricted, or Transferred. Injuries serious enough to require time off or job modification. |
| LTIFR | Lost Time Injury Frequency Rate. Injuries causing time off work per million hours worked. |
| Severity Rate | Total days lost due to injuries. Distinguishes between many minor cuts vs. fewer serious injuries. |
| EMR | Experience Modification Rate. Workers’ comp insurance modifier. Below 1.0 = lower premiums. Above 1.0 = higher costs. |
| Workers’ Comp Costs | Direct costs (medical, wages) plus indirect costs (productivity loss, admin time). OSHA estimates $2-3 indirect for every $1 direct. |
| Fatality Rate | Work-related deaths per 100,000 workers. Construction accounts for 20% of all workplace fatalities. |
Leading Indicators: Early Warning Signals
Leading indicators are proactive. They measure activities and conditions that predict whether incidents will happen.
| Indicator | What It Measures |
|---|---|
| Near-Miss Reports | Events that could have caused injury but didn’t. Healthy programs have 5-10 near-misses per recordable injury. |
| Training Effectiveness | Completion rates, assessment scores, behavioral changes post-training. Quality training shows comprehension, not just clicks. |
| Safety Audits & Observations | Formal audits, informal observations, behavior-based safety observations. Track findings, quality, and trends. |
| Job Hazard Analyses (JHAs) | Number of JHAs completed before task start. Proactive hazard identification and control measures. |
| PPE Compliance | Percentage of workers observed wearing required PPE correctly. Track by type and crew for patterns. |
| Corrective Action Time | Average days from hazard identification to fix completion. Overdue backlogs kill reporting culture. |
| Toolbox Talk Quality | Frequency, attendance, whether site-specific hazards are discussed. Sample for quality, not just count. |
| Safety Culture Surveys | Employee perceptions of safety culture and psychological safety. Do workers feel safe reporting hazards? |
| Worker Participation | Percentage on safety committees, safety committee meeting frequency, suggestions submitted, engagement in programs. |
| Hazard ID Rate | Number of hazards identified through inspections and observations. Break down by severity. |
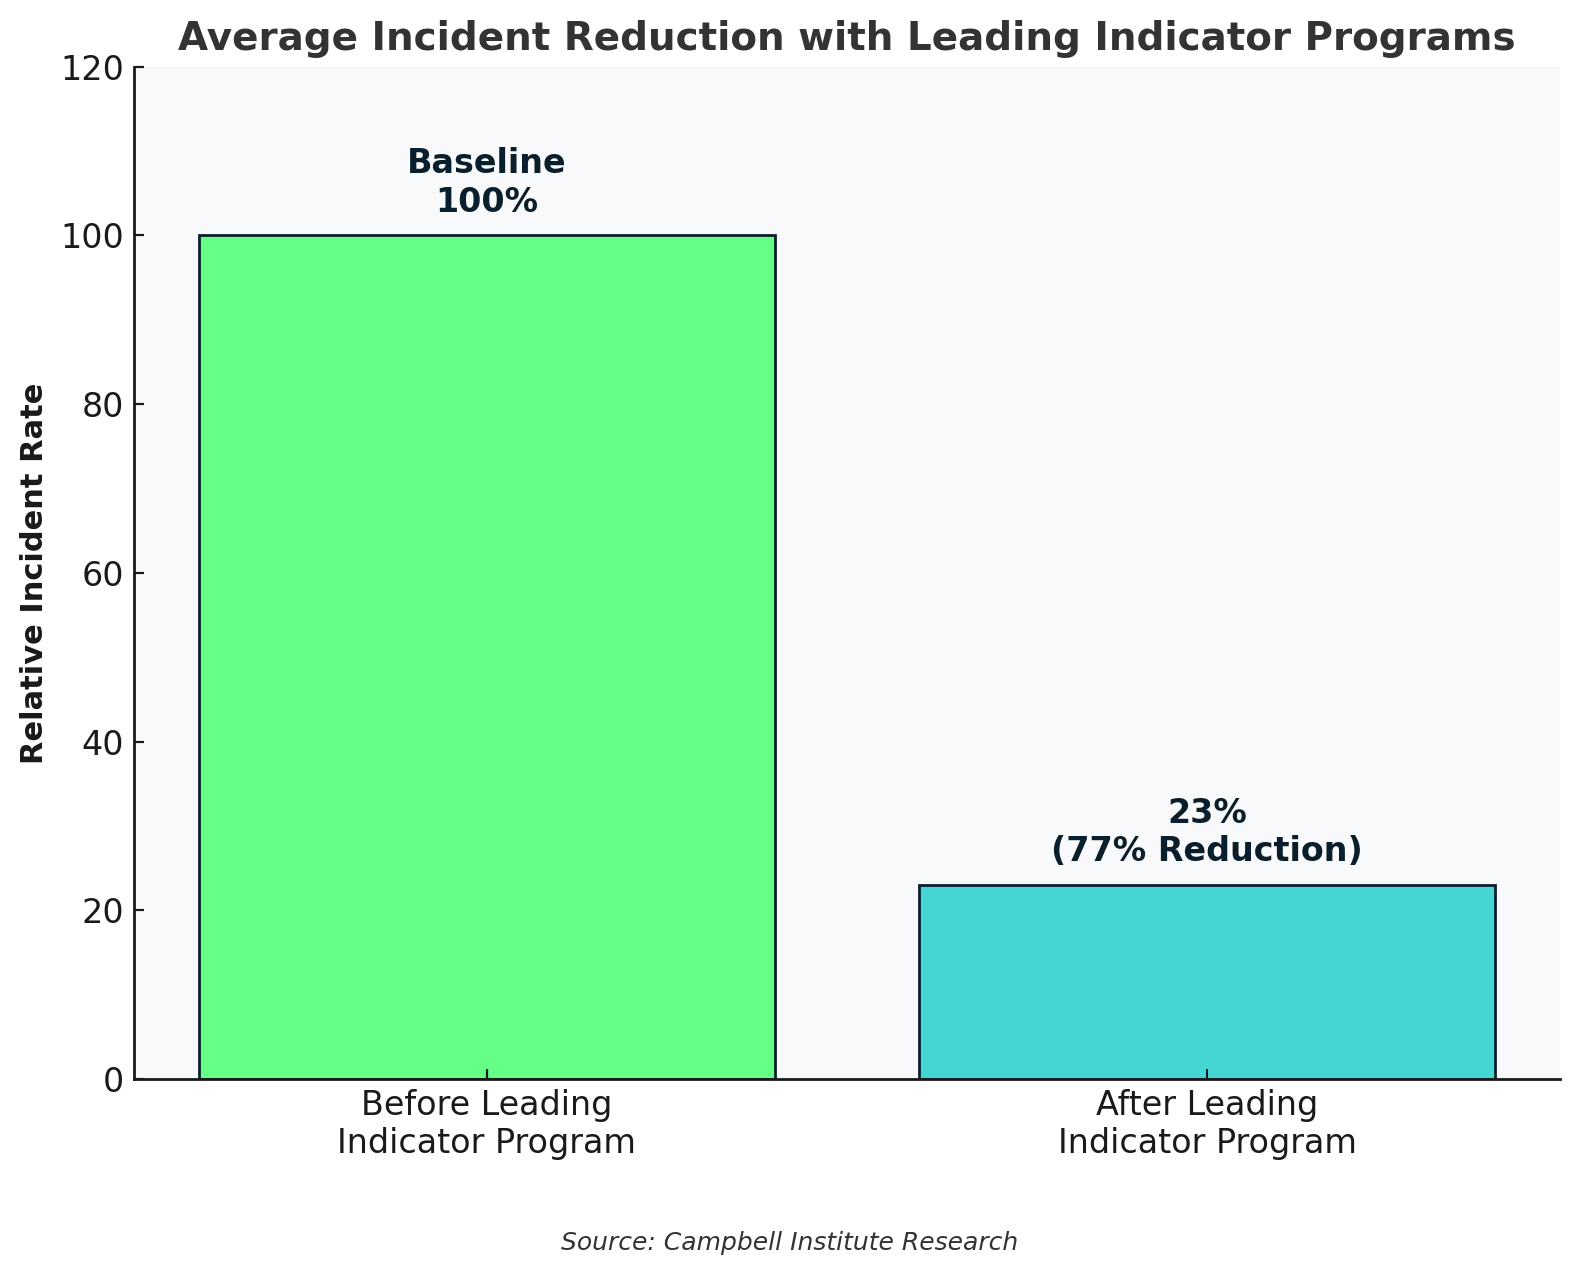
According to Campbell Institute research, organizations with established leading indicator programs see an average 77% reduction in incident rates.
Why You Need Both Lagging and Leading Indicators in your Safety Metrics.
Lagging indicators alone: By the time these numbers move, you’ve already paid the price. Someone got hurt. Productivity dropped. Insurance premiums went up. Lagging indicators are essential for compliance and benchmarking, but they can’t prevent the next injury.
Leading indicators alone: If your near-miss reports go up but injuries don’t go down, something’s broken. Either you’re not fixing identified hazards, or the metrics aren’t predictive of your actual injury types.
How they work together: Lagging indicators tell you what injury types you’re experiencing. Leading indicators tell you whether your prevention activities are working before the next injury happens.
You don’t need to track 30 metrics to see results. Start here:
- Pick 2-3 lagging indicators: Start with TRIR and DART. Add severity rate if you want more depth.
- Pick 3-5 leading indicators: Choose ones that predict your actual injury types. If you have fall injuries, track fall protection observations and training.
- Track both monthly: Plot them on the same chart. Look for patterns over 3-6 months.
- Act on leading indicators: When they flash warning signals, intervene before injuries happen.
- Validate with lagging indicators: Check if your interventions actually reduce TRIR and DART.
The key: Track leading indicators that predict your specific lagging indicators. If you have fall injuries, track fall protection training and observations. If you have strain injuries, track manual handling training and mechanical aid use. Then verify the relationship. When near-misses spike, do injuries follow? When training improves, does TRIR drop?
Get Started with Our Free Safety Metrics Dashboard
To help you track both leading and lagging indicators effectively, we developed a Safety Metrics Dashboard template completely free to download and use.
Download Your Free Safety Metrics Dashboard →
Training effectiveness is one of the most critical leading indicators. Explore eTraining’s Interactive Courses to see how quality training connects to measurable safety outcomes.
References: VelocityEHS (2024), BLS (2023), Campbell Institute research